Tornadoes in History
1. Tri-state Tornado
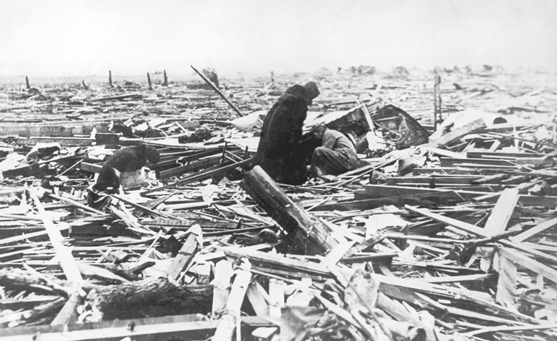
In 1925 there was no organized tornado warning system, so the tornado took most people by surprise. Forecasters did not have today’s tools.
Stats
-
 Date: March 18, 1925
-
 Fujita scale intensity: F5
-
 Dead: 689
-
 Injured: More than 2,000
-
 Damage: Over $2 billion (2020 values)
Damage
- The tornado first touched down in northeast Missouri around 1 p.m. It briefly lifted up, as weak tornadoes often do, but then touched back down and grew into a monster. On average the tornado measured 0.4 kilometers (a quarter-mile) wide.
- Miners in West Frankfort, Illinois, were 500 feet (152 meters) underground. When the power died, they climbed up through a shaft and found their homes smashed and many loved ones dead, injured, or missing. It had killed 127 people, mostly women and children.
- The tornado plowed a continuous swath of damage for 352 kilometers (219 miles) from near Redford, Missouri, to the east of Princeton, Indiana.
- In Murphysboro, Illinois, the tornado wiped out 100 blocks; another 70 were destroyed by fire.
- Not a single building survived in Griffin, Indiana. World War I veterans said the devastation resembled European battlefields.
- At one point the tornado traveled at 117 kilometers (73 miles) an hour before petering out at 4:30 p.m.
Aftermath
- The Tri-State Tornado is the deadliest and longest-lasting tornado on record in the United States.
- In its record three-and-a-half-hour spree across Missouri, Indiana, and Illinois, the tornado killed nearly 700 people, destroyed 15,000 homes, and obliterated town after town.
-
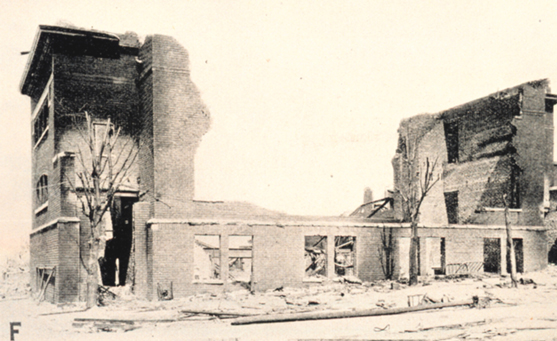
Ruins of the Baptist Church at Murphysboro, Illinois. A casualty of the Tri-State Tornado, the longest-lived and longest path of any recorded tornado. Photograph by NOAA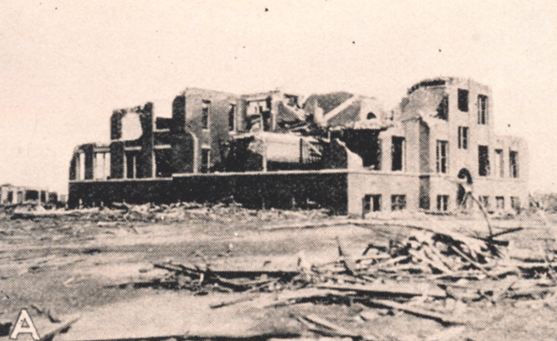
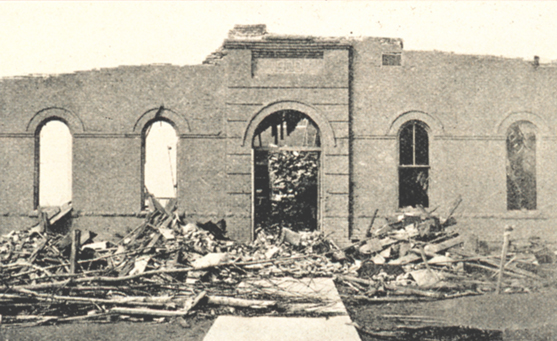
Ruins of the Longfellow School in Murphysboro, Illinois where 17 children were killed. Photograph by NOAA -
Ruins of the De Soto, Illinois, public school where 33 children were killed. Photograph by NOAA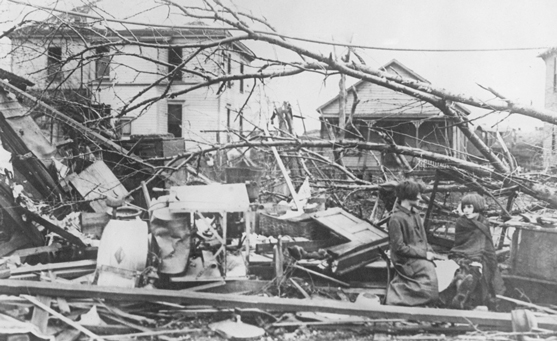
Minnie (left) and Rose Hawkins sit amongst the wreckage of their home in Murphysboro, Illinois, in the wake of the Tri-State Tornado, March 1925. Photograph by Topical Press Agency/Hulton Archive/Getty Images -
Inhabitants comb the wreckage of the town of Griffin, Indiana. Photograph by Topical Press Agency/Hulton Archive/Getty Images
2. PALM SUNDAY OUTBREAK
On Palm Sunday 1965, churchgoers in the Great Lakes were complaining about the unusual heat, but there were no storms forecast for the region.
Stats
-
Date: April 11-12, 1965
-
Fujita scale intensity: F0-F5
-
Dead: More than 260
-
Injured: 3,400
-
Damage: More than $1,631 million
(in 2020)
Damage
- Severe thunderstorms across the Upper Midwest sparked 51 tornadoes in 12 hours, pummeling Indiana, Ohio, and Michigan especially hard.
- Caught off guard, the National Severe Storms Forecast Center in Kansas City, Missouri, raced to send out tornado warnings, but many people didn't hear them. There were no outdoor tornado sirens at the time, and many TV and radio stations did not regularly air weather alerts. In addition, many towns were cut off from communications because the severe storms had knocked out all power and telephone lines.
- Those residents who did hear the warnings were confused by them—what was the difference between a tornado forecast and a tornado alert?
Aftermath
The lack of warning contributed to more than 260 deaths and 3,400 injuries when the second largest tornado outbreak in U.S. history struck. In response to the deadly confusion on Palm Sunday, the national warning system was refined to tornado "watches" and "warnings." A watch means conditions are favorable for tornadoes, and a warning means a tornado has been sighted or indicated by radar.
-
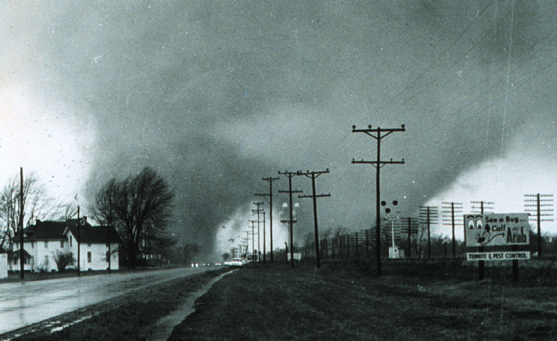
Twin funnels on Palm Sunday 1965 in Elkhart, Indiana. Photograph by Paul Huffman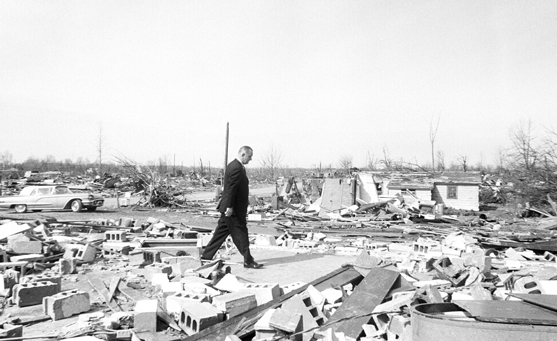
U.S. President Lyndon Baines Johnson (1908 - 1973) tours the wreckage after a Palm Sunday tornado outbreak in the midwest, April 14, 1965. Photograph by Stoughton/Interim Archives/Getty Images -
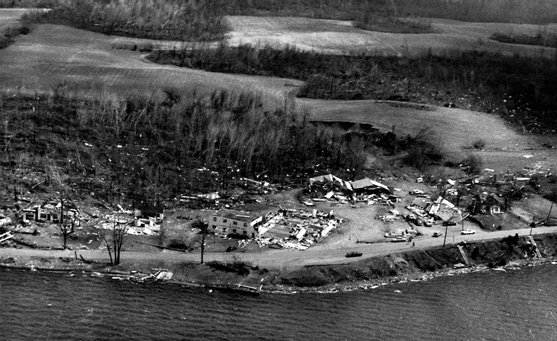
Destruction in the Manitou Beach–Devils Lake area in Michigan. Photograph by NOAA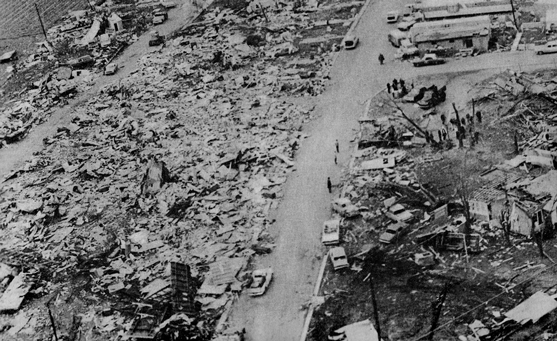
The remains of the Midway Trailer Park in Midway, Indiana, following the F4 tornado. Photograph by National Weather Service -
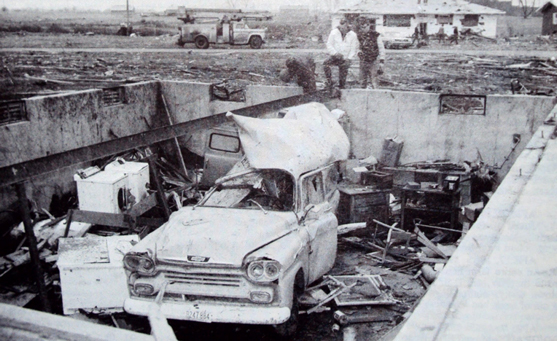
A truck landed on the empty foundation of a home in Crystal Lake, Illinois. Photograph by National Weather Service
3. SUPER OUTBREAK
During the worst tornado outbreak in U.S. history, nearly 150 tornadoes touched down in 13 states.
Stats
-
Date: April 3-4, 1974
-
Fujita scale intensity: F0-F5
-
Dead: 330
-
Injured: 5,484
-
Damage: $4.6 billion (2020 values)
Damage
- Over a 16-hour period, more than 300 people were killed and more than 5,000 hurt.
- Spawned from severe thunderstorms, the tornadoes varied from F0 to F5.
- At one point 15 tornadoes were on the ground at the same time.
- One tornado lasted for more than two hours.
- Another two tornadoes swirled around each other, caught in a violent dance.
- Thirteen states—Alabama, Georgia, Illinois, Indiana, Kentucky, Michigan, Mississippi, North Carolina, Ohio, South Carolina, Tennessee, Virginia, and West Virginia—saw tornadoes.
- The most damaging and deadly touched down in Xenia, Ohio, where the F5 tornado leveled half of the town in just nine minutes. Winds topped 418 kilometers (260 miles) an hour. Four schools, nine churches, and more than 1,300 homes and businesses were totaled. Nearly half of the town's population of 25,000 were left homeless.
Aftermath
- Although National Weather Service forecasters saw the potential for tornadoes to develop, they had to wait for a tornado sighting before they could issue a warning. Today more sophisticated technology lets forecasters see storms evolving, and warnings are often issued before tornadoes even form. The result is an average warning time of 14 minutes.
-
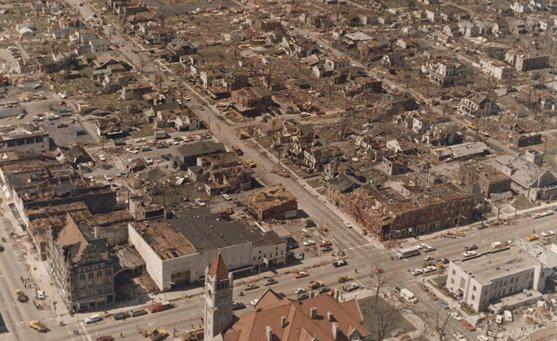
Xenia, Ohio city center tornado damage from Super Tornado Outbreak of April 3, 1974 (1 of 3). Photograph by United States Air Force, Wright-Patterson AFB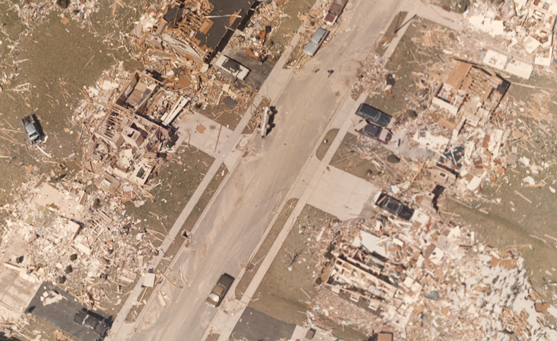
Xenia, Ohio city center tornado damage from Super Tornado Outbreak of April 3, 1974 (2 of 3). Photograph by United States Air Force, Wright-Patterson AFB -
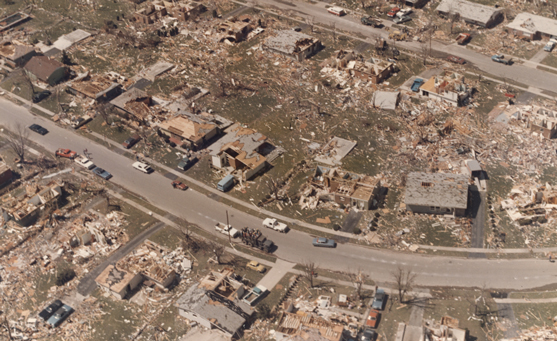
Xenia, Ohio city center tornado damage from Super Tornado Outbreak of April 3, 1974 (3 of 3). Photograph by United States Air Force, Wright-Patterson AFB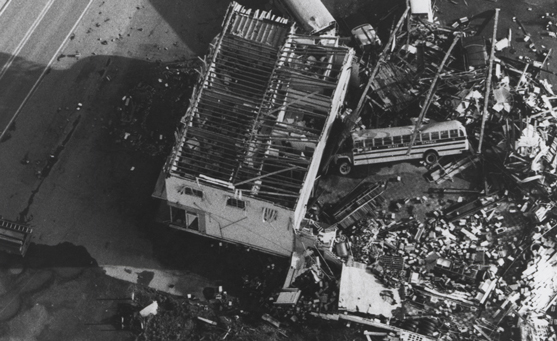
A school bus was tossed into a private garage in Brandenburg, Kentucky. Photograph by NOAA -

Audubon Elementary School tornado damage from Super Tornado Outbreak. Photograph by NOAA
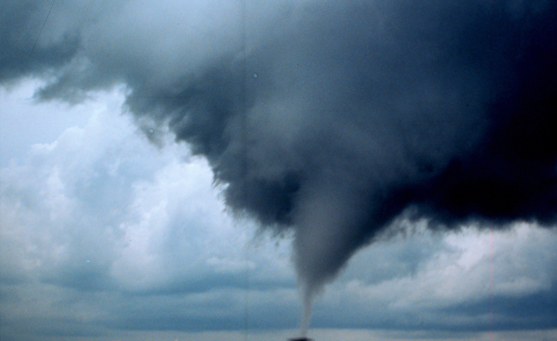
4. OKLAHOMA OUTBREAK
May 3, 1999, meteorologists were on alert—conditions were perfect for severe weather in Tornado Alley. Cold air from the west was clashing with warm, moist air to the east. Large thunderstorms were likely and tornadoes a definite possibility.
The National Weather Service called in extra staff to monitor the situation.
Stats
-
Date: May 3, 1999
-
Fujita scale intensity: F0-F5
-
Dead: 47
-
Injured: More than 775
Damage
- At least 45 tornadoes touched down in Oklahoma although states from Texas to South Dakota saw tornadoes that day.
- Oklahoma experienced the most violent tornado; an immense F5 tornado traveled about 61 kilometers (38 miles) and ravaged the suburbs of Oklahoma City. It developed near the town of Amber and quickly grew to nearly 1.2 kilometers (three-quarters of a mile) wide. By the time the tornado reached Bridge Creek, it had widened into a monstrous 1.6-kilometer (one-mile) vortex.
- The tornado peeled 2.5 centimeters (one inch) of asphalt pavement from a rural road and wrapped roofing material neatly around power lines.
- In one area, more than 200 homes were lifted from their foundations.
- The bark was stripped from cedar trees.
- Vegetation was torn away, leaving mud and red dirt exposed.
Aftermath
- Early warnings were credited for saving more than 700 lives.
- NASA scientists, studying the area with satellites, estimated it will take from 10 to 20 years for the vegetation in tornado-ravaged areas to grow back. In some areas the tornado picked up 0.3 meter (nearly a foot) of topsoil, stripping the earth of nutrients.
- The tornado generated about 1.5 million cubic meters (2 million cubic yards) of debris and waste in just a few hours—as much as Oklahoma City would create in an entire year.
- Witnesses said the air smelled like sawdust because so many structures were ripped to shreds.
-
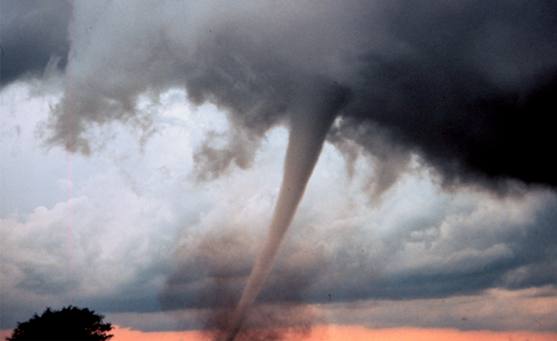
This F3 tornado was the first of a dozen tornadoes documented by scientists in the field on May 3, 1999. The same storm later produced an F5 tornado in Newcastle, Moore, and Del City, Oklahoma. Photograph by OAR/ERL/National Severe Storms Laboratory (NSSL)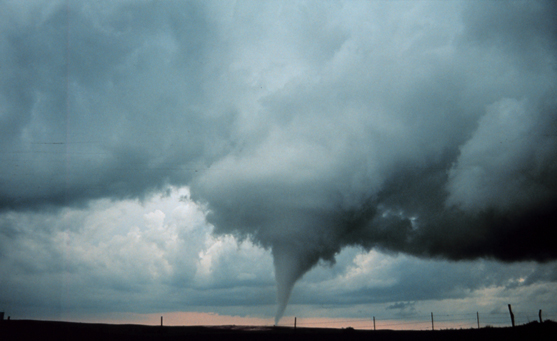
A total of 74 tornadoes touched down across Oklahoma and Kansas in less than 21 hours. Photograph by OAR/ERL/National Severe Storms Laboratory (NSSL) -
A total of 74 tornadoes touched down across Oklahoma and Kansas in less than 21 hours. Photograph by OAR/ERL/National Severe Storms Laboratory (NSSL)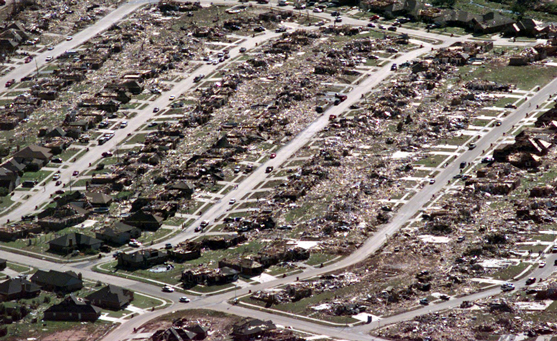
A tornado's path is traced with intact homes on both sides of this neighborhood while others in the middle lie destroyed in Moore, Oklahoma, two days after tornadoes ripped through this area. Photograph by Tannen Maury -
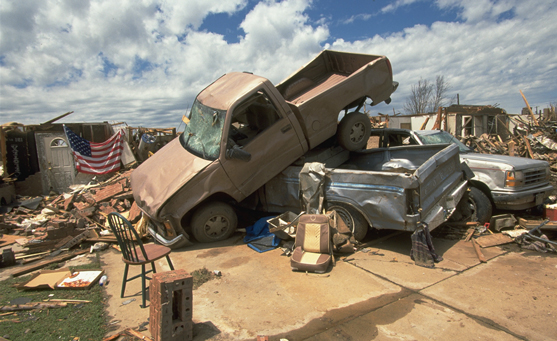
Heavy damage in Oklahoma City, Oklahoma following an F5 tornado. Photograph by Ted Soqui/Sygma
5. LA PLATA, MARYLAND
The strongest tornado on record in Maryland developed from a supercell thunderstorm.
Stats
-
Date: April 28, 2002
-
Fujita scale intensity: F2, F4
-
Dead: 3
-
Injured: 122
-
Damage: More than 142 million dollars (2020 values)
- The storm dropped hail in West Virginia and spawned its first tornado, an F2, around 4:45 p.m. in Virginia. The whirlwind destroyed or damaged more than a hundred buildings before dissipating.
- Around 7 p.m., as the storm crossed the Potomac River into Maryland, another much bigger tornado touched down.
- The tornado raced at 97 kilometers (60 miles) per hour through the countryside before strengthening and heading straight through downtown La Plata.
- It decimated the town center in seconds, destroying more than 600 houses and businesses. Many homes were swept off their foundations by wind speeds greater than 160 kilometers (100 miles) per hour.
- The tornado continued into Calvert County, then crossed the Chesapeake Bay to Maryland's Eastern Shore.
- In all, the tornado traveled about 113 kilometers (70 miles), an unusually long path for an East Coast tornado.
- During its run the tornado increased from an F1 with 160 kilometers (100 miles) per hour winds to an F4 with 418 kilometers (260 miles) per hour winds.
-
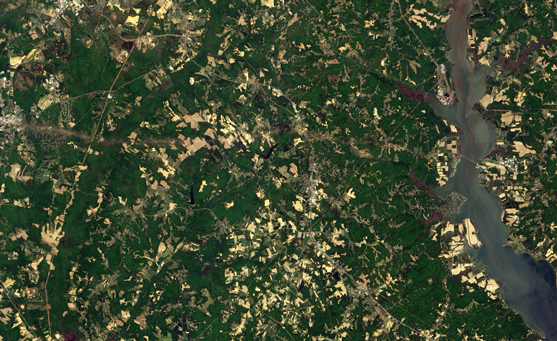
The tornado’s path can be seen clearly in this pan-sharpened color image; La Plata is situated toward the lefthand side of this scene and the tornado's swath is the bright stripe passing through the town and running eastward 10 kilometers (6 miles) toward the Patuxent River beyond the right-hand side of the image. This stripe is the result of the vegetation flattened by the storm. The flattened vegetation reflects more light than untouched vegetation. NASA Earth Observatory image created by Jesse Allen, using data provided courtesy Lawrence Ong, EO-1 Mission Science Office, NASA GSFC.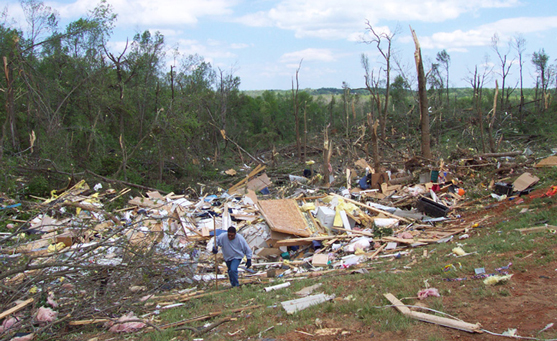
Damage from the La Plata, Maryland tornado. Photo courtesy of NOAA's National Weather Service Baltimore/Washington Forecast Office -
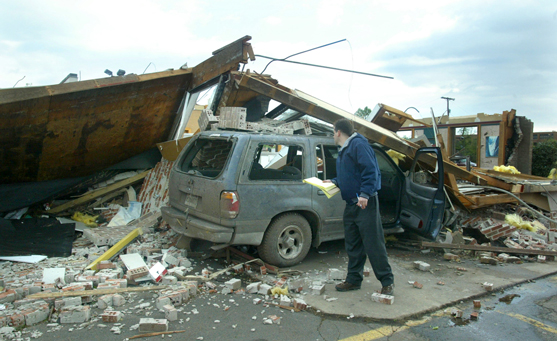
An investigator surveys the damage of a Kentuky Fried Chicken that was demolished when a tornado tore through on April 29, 2002, La Plata, Maryland. Photograph by Mark Wilson/Getty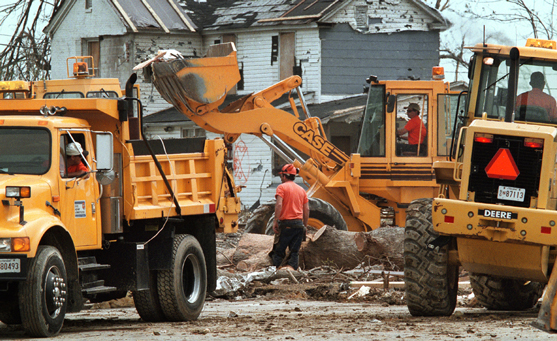
Maryland State Highway Association arranged for over 100 trucks to descend on beleagured La Plata, to help clear away debris from the tornado. Photograph by Bill O'Leary/The Washington Post -
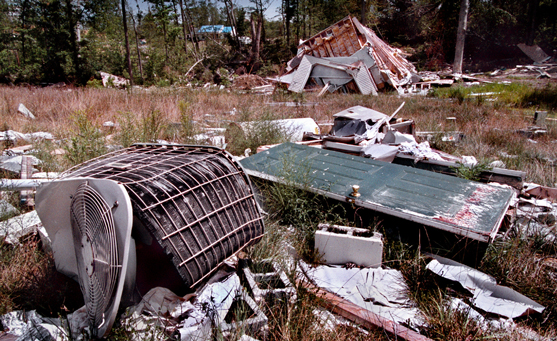
This house in Hughesville, MD was obliterated in the tornado. Photograph by Michael Williamson/The Washington Post
6. South Oklahoma City and the City of Moore
Severe weather started in the Oklahoma area on May 18, 2013. On May 20, this produced an EF5 tornado, the deadliest of the year for the United States.
Stats
-
Date: May 20, 2013
-
Fujita scale intensity: EF5
-
Dead: 24
-
Injured: Scores
-
Damage: Billions of dollars
The tornado’s path
- Several supercell thunderstorms developed during early afternoon of May 20th along a dryline (separating moist and dry air masses) in central Oklahoma.
- One of these storms developed near Chickasha and rapidly intensified, producing a tornado which touched down at 2:56 p.m. CDT on the west side of Newcastle.
- The tornado became violent within minutes, then tracked east-northeastward across the city of Moore and parts of south Oklahoma City for about 40 minutes before finally dissipating near Lake Stanley Draper.
Aftermath
- The tornado caused catastrophic damage and was given a maximum rating of EF5.
-
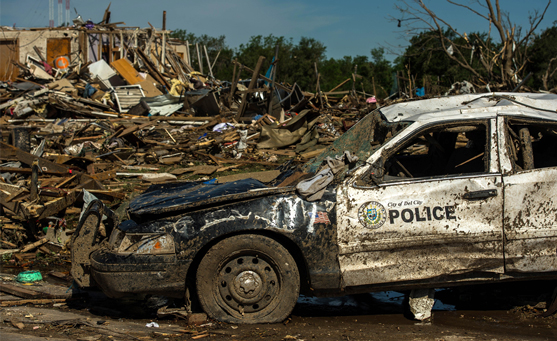
A police car was destroyed by a tornado in Moore, Oklahoma, May 22, 2013. U.S. Air Force photo by Staff Sgt. Jonathan Snyder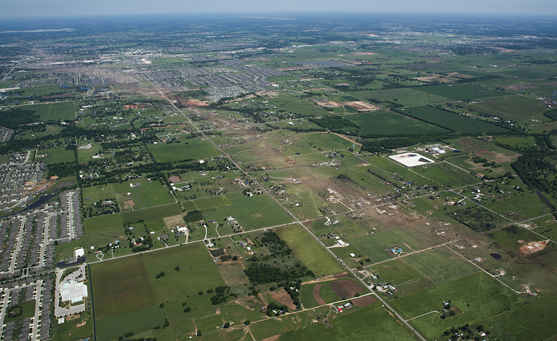
The path of the EF-5 tornado is clearly visible in this aerial view of Moore, Oklahoma. U.S. Air Force photo by Tech. Sgt. Bradley C. Church -
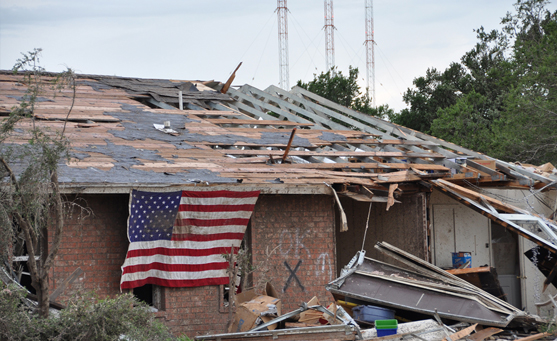
An American flag hangs from a home devastated by a tornado that hit the town of Moore, Oklahoma, near Tinker Air Force Base. U.S. Air Force photo by Maj. Jon Quinlan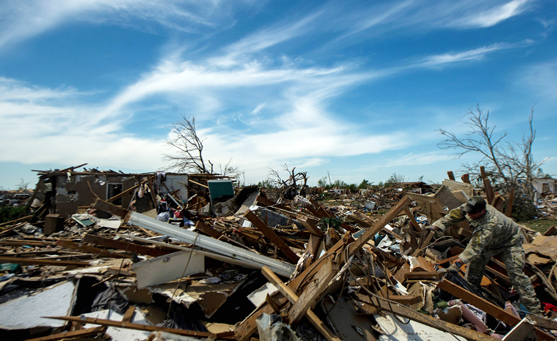
Technical Sgt. Brandon White, 138th Combat Training Flight joint terminal attack controller, helps a Moore, Oklahoma resident search through debris for salvageable items May 22, 2013. U.S. Air Force photo by Staff Sgt. Jonathan Snyder -
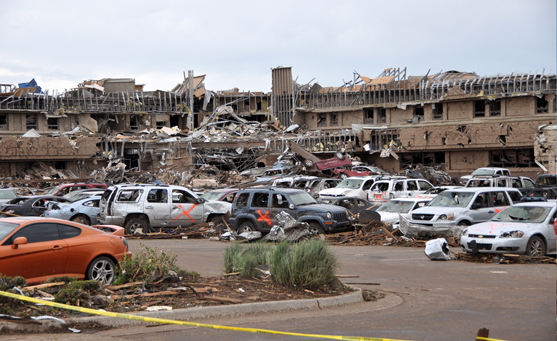
The Norman Regional Health System Moore Medical Center in Oklahoma lays devastated after a massive tornado touched down on May 20, 2013. The hospital was directly in the path of the 1.3 mile wide tornado that hit Moore in the late afternoon. U.S. Air Force photo by Senior Airman Mark Hybers
7. Havana, Cuba
The tornado was Havana's first in more than a decade.
Stats
-
Date: January 27, 2019
-
Fujita scale intensity: EF3
-
Dead: 3
-
Injured: 172
- Powerful winds up to 100 kilometers (60 miles) per hour and heavy rains battered the city.
- Trees were uprooted and poor areas of the city lost power.
- Windows were blown out, roofs caved in and massive trees toppled onto cars.
- Damage was severe, homes were destroyed and trucks overturned.
-
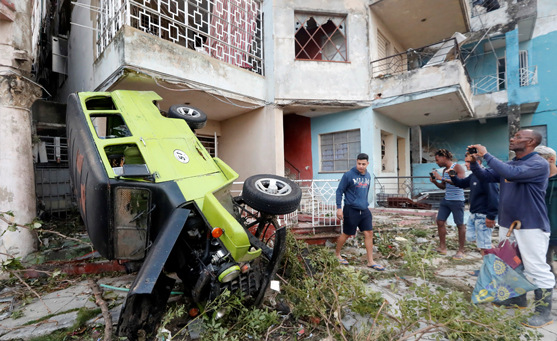
People observe a vehicle affected by a tornado in Havana, Cuba on January 28, 2019. Photograph by Ernesto Mastrascusa / EPA-EFE / Shutterstock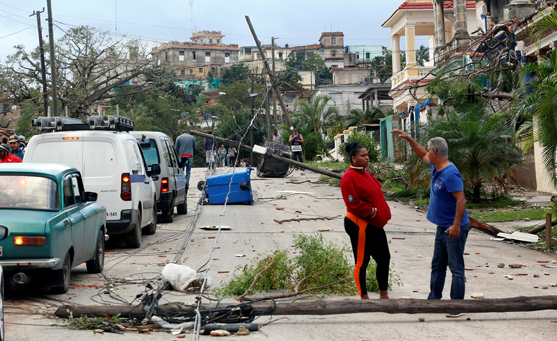
People affected by the tornado talk in a street in the Regla area. Photograph by Ernesto Mastrascusa / EPA-EFE / Shutterstock -
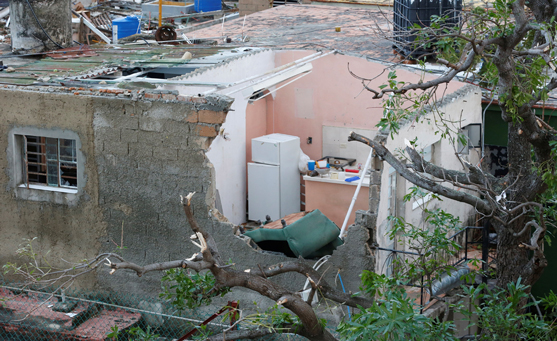
A house affected by a tornado in Havana, Cuba. Photograph by Ernesto Mastrascusa / EPA-EFE / Shutterstock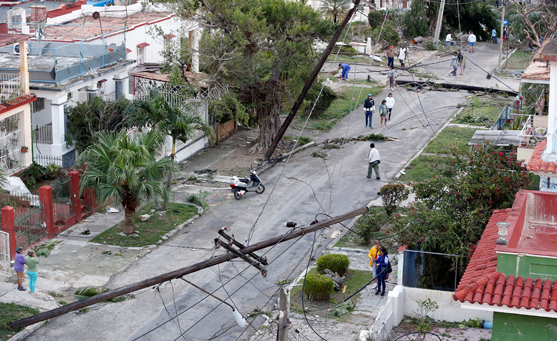
People walk through a street affected by a tornado. Photograph by Ernesto Mastrascusa / EPA-EFE / Shutterstock -
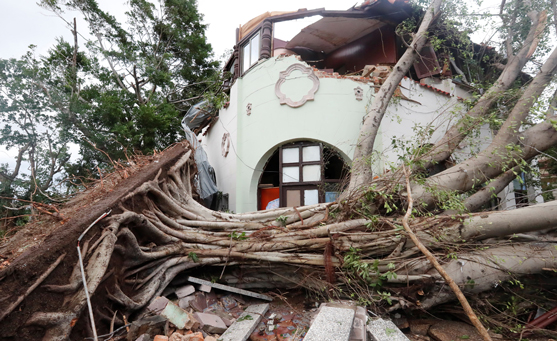
View of a house partially destroyed by fallen trees due to the tornado in Havana, Cuba. Ernesto Mastrascusa / EPA-EFE / Shutterstock
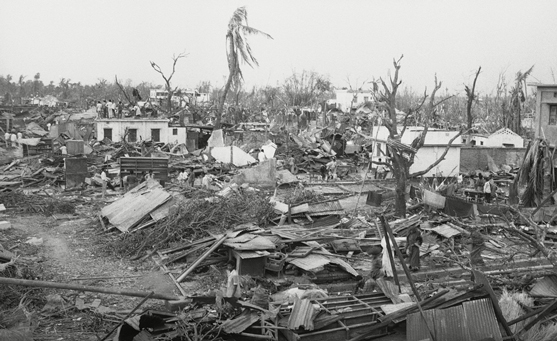
8. Saturia–Manikganj Sadar, Bangladesh
The World Meteorological Organization deemed this the world's single deadliest tornado. The region had been suffering from drought leading up to the tornado.
Stats
-
Date: April 26, 1989
-
Fujita scale intensity: F3-F4
-
Dead: approximately 1,300
-
Injured: more than 12,000
-
Homeless: more than 80,000
The tornado’s path
Striking at around 6:30 p.m. local time, the tornado moved east from the Daulatpur area into the towns of Saturia and Manikganj Sadar. The tornado’s path was 1.6 kilometers (1 mile) wide and 16 kilometers (10 miles) long. Both towns were destroyed.
Aftermath
The towns were left in ruins and 80,000 people were left homeless. All buildings within the 6 square kilometers (2.5 square miles) were destroyed. Thousands of trees were uprooted. It was difficult to assess the wind speed given the flimsy nature of the buildings.
-
A 15-minute tornado battered 20 villages in the Manikganj district outside Dhaka, Bangladesh, leaving at least 500 people dead and a few thousand injured. Photograph by Pavel Rahman / AP / Shutterstock
Villagers left homeless by the tornado on April 26, 1989 in central Bangladesh gather the ruins of their houses in Dhaka, in hopes of rebuilding what was destroyed by the tornado which claimed more than 800 lives, leaving 12,000 injured and 130,000 homeless. Photograph by Pavel Rahman / AP / Shutterstock -

A survivor in Dhaka, Bangladesh, ponders over her future amid the ruins. Photograph by Pavel Rahman / AP / Shutterstock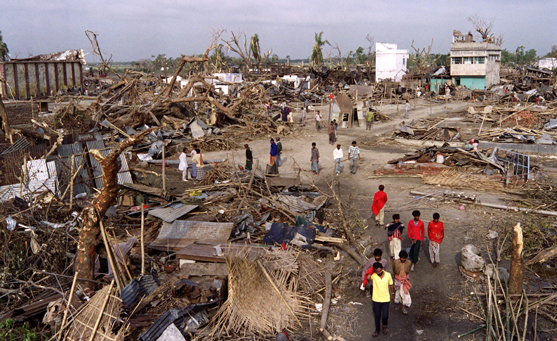
Picture taken on May 1, 1989 at Saturia showing the destructions made by the powerful tornado and the inhabitants searching materials for the construction of primitive shelters. Photograph by David L. Nelson / Getty Images
9. EUROPEAN TORNADOES
- The United Kingdom has the highest frequency of tornadoes in Europe, although they are usually small and do little damage. On average, there are 50 tornadoes (both documented and undocumented) every year. Most occur in southern England.
- Early-winter cold fronts often spark tornado outbreaks as the cold air moves rapidly across the U.K. from the north and the west.
- The largest outbreak in Britain occurred on November 21, 1981, when a strong front spawned 105 tornadoes in under six hours. The tornadoes were weak, and no one was killed.
- In 1950 a tornado traveled at least 106 kilometers (66 miles) through southern England, uprooting trees and wrecking hundreds of homes.
- In October 2000 a tornado struck the town of Bognor Regis in West Sussex, damaging a hundred homes before petering out.
- The Netherlands has Europe's second highest tornado frequency, with about 35 tornadoes every year.
- In Europe a typical tornado lasts fewer than ten minutes and has top wind speeds of 177 kilometers (110 miles) an hour or less.
-
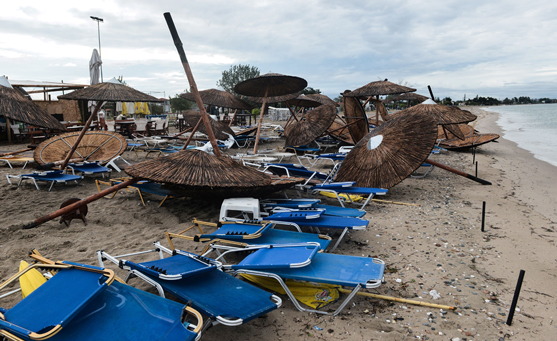
A picture taken on July 11, 2019 shows damaged umbrellas and lounge chairs on a beach after a storm in Nea Plagia, Chalkidiki, Northern Greece. Photograph by Sakis Mitrolidis / Getty Images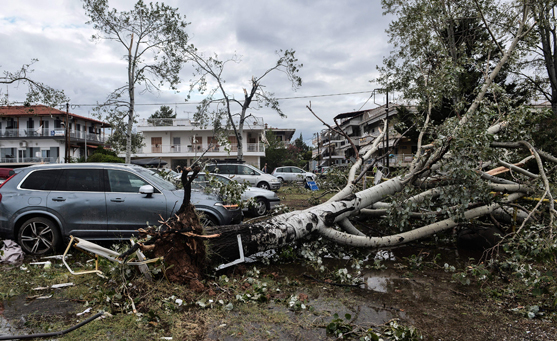
A picture taken on July 11, 2019 shows broken trees fallen on cars after a storm in Nea Plagia, Chalkidiki, Northern Greece. Photograph by Sakis Mitrolidis / Getty Images -
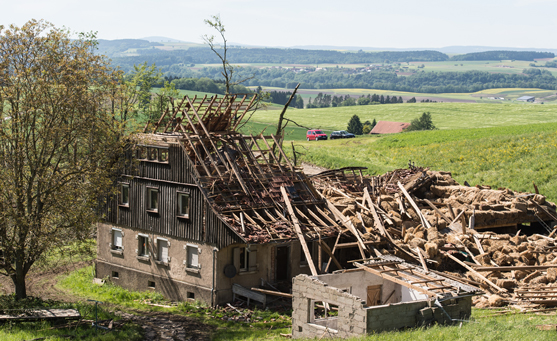
A destroyed farm is pictured in Fuetzen, Germany, May 18, 2015, after a tornado hit the Black Forest region causing extensive damage. Photograph by Patrick Seeger / Picture Alliance / Getty Images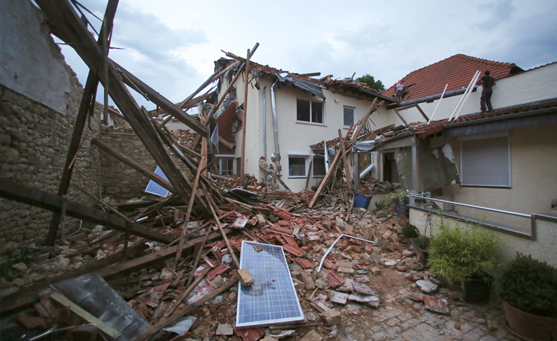
View of a destroyed house following a heavy storm in Framersheim, southwest Germany, July 7, 2015. Photograph by Fredrik von Erichsen / Picture Alliance / Getty Images -
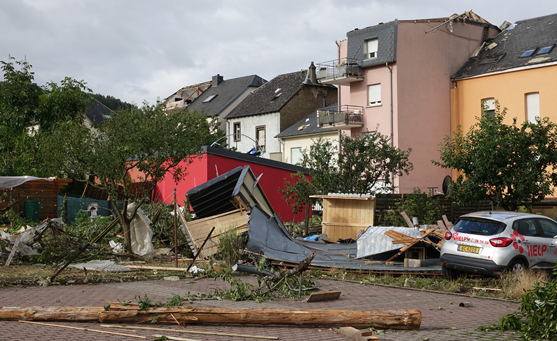
In the southwest of Luxembourg, a tornado caused serious damage on August 10, 2019. Photograph by Harald Tittel / Picture Alliance / Getty Images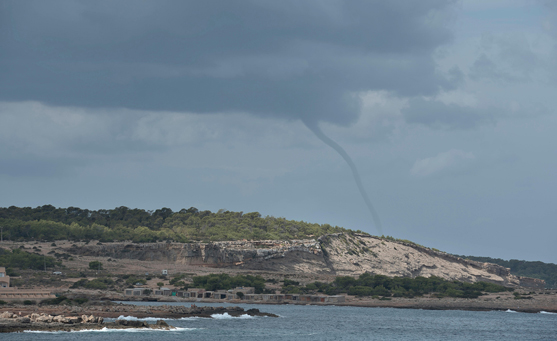
A tornado near Sant Antoni, Ibiza, Spain. Photograph by ImageBROKER / Alamy Stock Photo