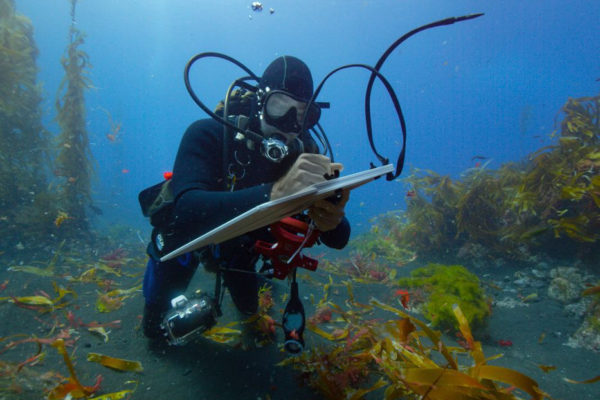
1. Discuss indicators of the health of a body of water such as the Chesapeake Bay.
Discuss with students about the value of a healthy watershed. Ask: In what ways do you think the Chesapeake Bay watershed is important to humans? (Student responses may include the seafood we eat, the water we drink from reservoirs, and fishing, hunting, and other recreation in and around the waterways.) Ask: How can we know if the Chesapeake Bay and other waterways in the watershed are healthy and safe? (Answers may include that there is abundant wildlife, including birds, fish, crabs, and oysters, and that pollutants are not found in the water.)
Explain that scientists monitor the health of the bay and watershed by analyzing what is in the water and also the populations of species that live in and around the bay. Scientists are continuously measuring the amount of oxygen in the water, among other measures.
2. Have a whole class discussion about dissolved oxygen and the health of the Chesapeake Bay and its tributaries.
Ask students why oxygen is important in underwater ecosystems. Help them recognize that a variety of organisms need oxygen to survive, and as part of food webs, the balance of species in an ecosystem depends on appropriate levels of oxygen as well as other needs. Explain that scientists measure dissolved oxygen to monitor conditions in these underwater habitats, checking if they are healthy or not. Dissolved oxygen is a water quality measurement that changes over time, and depends on the temperature of the water and other factors. Underwater ecosystems are sensitive to changes to dissolved oxygen levels, and these levels can fluctuate greatly and be affected by human activities on land.
Review together the Chesapeake Bay Program’s webpage with an overview of dissolved oxygen. Ask:
- Why is dissolved oxygen an important water quality measure to monitor? (Almost all life found in the underwater habitats of the Chesapeake Bay depends on the availability of dissolved oxygen in the water.)
- Why do you think dissolved oxygen levels change over time? (Changes in air and water temperature naturally affect the amount of dissolved oxygen in the water, but human impacts from farming and urban development can lead to very low, unhealthy levels of dissolved oxygen in the bay.)
- What do you think a dead zone is? (Low dissolved oxygen levels can lead to areas where almost no life can survive due to lack of oxygen, referred to as dead zones.)
Explain that these low-oxygen dead zones occur often in bodies of water around the world, including the Chesapeake Bay. Project the National Geographic encyclopedia entry for dead zones, and view the illustrations and captions together. Have students use this entry and Chesapeake Bay Program’s Dissolved Oxygen webpage as references for this activity.
Explain and write on the board these key measures:
- 5.0 mg/L or higher is an ideal dissolved oxygen level for an estuary such as the Chesapeake Bay.
- Below 5.0 mg/L, aquatic organisms can become stressed. The lower the level, the more organisms are unable to survive.
- 0 to 0.2 mg/L of dissolved oxygen is the measure for a dead zone.
3. Have students analyze dissolved oxygen level data from the Chesapeake Bay.
Tell students they will use FieldScope to examine the dissolved oxygen levels in the Chesapeake Bay and its tributaries. Distribute a copy of the handout Analyzing Watershed Health: Dissolved Oxygen to each student. Have students work in pairs or small groups at computers for this exercise.
Students will work on Part 1 of the worksheet. Students look at a color gradient that changes over a year’s time. Pause the activity after Part 1 to discuss as a class the seasonal changes of dissolved oxygen levels.
Students should infer that in summer months, warmer temperatures result in lower dissolved oxygen levels. Warm water can hold less oxygen than cooler water; so generally, Chesapeake Bay waters hold less oxygen in the summer than in winter. Also, spring rains can bring a lot of nutrient pollution into the bay, causing algal blooms that can lower the amount of dissolved oxygen in the water.
In winter months, cooler water temperatures and less runoff from agriculture help keep a more healthy dissolved oxygen level.
4. Have students analyze data in the Chesapeake Bay Interpretive Buoy System (CBIBS) data layer.
Have students turn now to the Chesapeake Bay Interpretive Buoy System (CBIBS) data in the layers tab. In Part 2, students create a graph to visualize dissolved oxygen data for the previous year in the Chesapeake Bay.
In Part 3, students refer back to the earlier data set but focus on the area near their location. Help students think about impacts from upstream and downstream where their water flows into the bay.
Informal Assessment
Monitor student activity while using FieldScope and check their worksheets for understanding.
Extending the Learning
1. Have students examine the data and its relationship to temperature in a graph. Have students add both dissolved oxygen and water temperature data from the CBIBS buoys to the FieldScope Time Series Plot tool. Graph roughly three months of data. Ask: What relationship do you see between dissolved oxygen and water temperature? Students should be able to describe an inverse relationship: As temperatures rise, dissolved oxygen levels fall; and as temperatures fall, dissolved oxygen levels rise.
2. Have students explore the dissolved oxygen and other data at several buoy locations. Have them develop their own questions, and test their questions using the map layers and features and/or the time series plot.
3. Have students explore further the abilities of different species to survive under conditions with different dissolved oxygen levels using the Chesapeake Bay Program’s Dissolved Oxygen webpage. Discuss how taking an inventory of species can give clues for water quality. Have students think of people other than scientists who might be aware of and monitor the health of waterways by observing the presence of different species: fishermen, sailors, birdwatchers, and other citizens who regularly observe the bay.
4. Have students research the other indicators of bay health using the Chesapeake Bay Report Card.
Subjects & Disciplines
- Biology
- Earth Science
- Geography
-
Social Studies
- Civics
- Economics
Learning Objectives
Students will:
- Describe the importance of oxygen to aquatic ecosystems
- Analyze dissolved oxygen levels over time around the Chesapeake Bay and near their home location by mapping and graphing data in FieldScope
Teaching Approach
- Learning-for-use
Teaching Methods
- Discussions
- Hands-on learning
Skills Summary
This activity targets the following skills:
-
21st Century Student Outcomes
- Learning and Innovation Skills
-
Critical Thinking Skills
- Analyzing
- Applying
- Understanding
- Geographic Skills
Connections to National Standards, Principles, and Practices
National Council for Social Studies Curriculum Standards
- Theme 3: People, Places, and Environments
National Geography Standards
- Standard 14: How human actions modify the physical environment
- Standard 15: How physical systems affect human systems
- Standard 3: How to analyze the spatial organization of people, places, and environments on Earth's surface
- Standard 4: The physical and human characteristics of places
National Science Education Standards
- (5-8) Standard D-1: Structure of the earth system
- (5-8) Standard F-2: Populations, resources, and environments
- (5-8) Standard F-5: Science and technology in society
Common Core State Standards for English Language Arts & Literacy
- Reading Standards for Informational Text 6-12: Key Ideas and Details, RI.7.2
- Reading Standards for Informational Text 6-12: Key Ideas and Details, RI.9-10.2
- Reading Standards for Informational Text 6-12: Key Ideas and Details, RI.6.2
- Reading Standards for Informational Text 6-12: Key Ideas and Details, RI.8.2
- Reading Standards for Informational Text K-5: Key Ideas and Details, RI.4.3
- Reading Standards for Informational Text K-5: Key Ideas and Details, RI.5.3
What You’ll Need
Materials You Provide
- Pencils, pens
Required Technology
- Internet Access: Required
- Tech Setup: 1 computer per small group
- Plug-Ins: Flash
Physical Space
- Classroom
- Computer lab
Grouping
- Large-group instruction
Background Information
The Chesapeake Bay is the largest estuary in the United States and is home to unique biodiversity. The bay plays an important role in local commerce and history, and is a critical environmental resource.
The Chesapeake Bay Interpretive Buoy System (CBIBS) is a system of buoys that reports real-time weather and environmental information about the Chesapeake Bay.
Prior Knowledge
- None
Recommended Prior Activities
Vocabulary
measure of the amount of oxygen in a substance, usually water.
Articles & Profiles
Tips & Modifications
Modification
If students have difficulty using the mapping or graphing tools in FieldScope, try projecting the FieldScope map onto a white board or other flat surface. Scroll through the months of the year, asking students to notice in which months dissolved oxygen levels are low, and which areas have the lowest levels of dissolved oxygen.
Tip
Students who have not used FieldScope before should use the tutorial at the start, and refer back to it if they have questions.
Modification
When doing Part 2 of the worksheet with younger students, teachers can select one of the CBIBS buoys and do the exercise with the class as a whole. Then students could investigate another set of data for another buoy in small groups if there is time.
Funder

This [activity] was prepared by National Geographic Society under award NA12SEC0080021 from the National Oceanic and Atmospheric Administration (NOAA), U.S. Department of Commerce. The statements, findings, conclusions, and recommendations are those of the author(s) and do not necessarily reflect the views of the National Oceanic and Atmospheric Administration (NOAA) or the U.S. Department of Commerce.