ENCYCLOPEDIC ENTRY

ENCYCLOPEDIC ENTRY

The Keeling Curve

The Keeling Curve

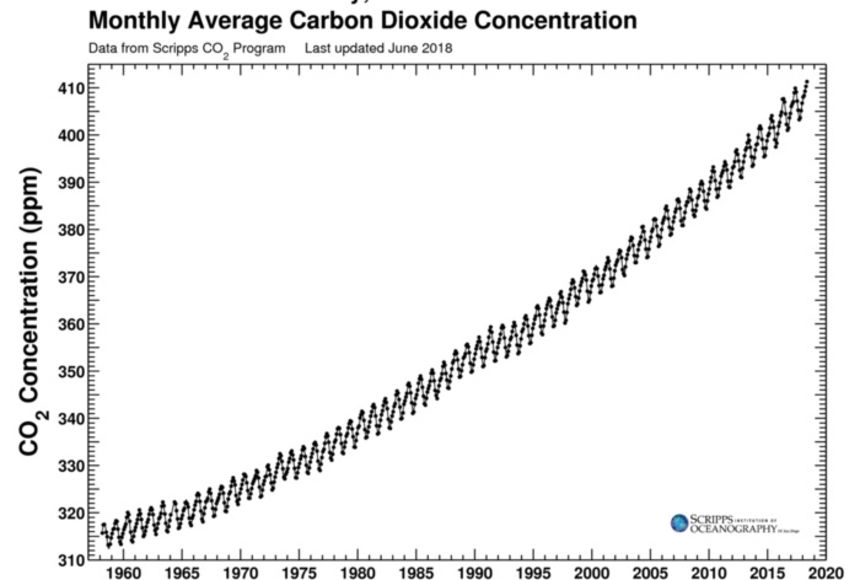
The Keeling Curve is a graph that shows the ongoing change in the concentration of carbon dioxide in Earth’s atmosphere.

Grades

9 - 12

Subjects

Earth Science, Climatology, Geography, Physical Geography

Image

Scripps Keeling Curve

Graph depicting the Scripps carbon dioxide (CO2) measurements recorded at the Mauna Loa Observatory.

Image by the Scripps Institution of Oceanography
Graph depicting the Scripps carbon dioxide (CO2) measurements recorded at the Mauna Loa Observatory.

The Keeling Curve is a graph that represents the concentration of carbon dioxide (CO2) in Earth’s atmosphere since 1958. The Keeling Curve is named after its creator, Dr. Charles David Keeling.

Keeling began studying atmospheric carbon dioxide in 1956 by taking air samples and measuring the amount of CO2 they contained. Over time he noticed a pattern. The air samples taken at night contained a higher concentration of CO2 compared to samples taken during the day. He drew on his understanding of photosynthesis and plant respiration to explain this observation: Plants take in CO2 during the day to photosynthesize—or make food for themselves—but at night, they release CO2. By studying his measurements over the course of a few years, Keeling also noticed a larger seasonal pattern. He discovered CO2 levels are highest in the spring, when decomposing plant matter releases CO2 into the air, and are lowest in autumn when plants stop taking in CO2 for photosynthesis.

Keeling was able to establish a permanent residence at the Mauna Loa Observatory in Hawai'i, United States, to continue his research. At Mauna Loa, he discovered global atmospheric CO2 levels were rising nearly every year. By analyzing the CO2 in his samples, Keeling was able to attribute this rise to the use of fossil fuels. Since its creation, the Keeling Curve has served as a visual representation of Keeling’s data, which scientists have continued to collect since his death in 2005.

Media Credits

The audio, illustrations, photos, and videos are credited beneath the media asset, except for promotional images, which generally link to another page that contains the media credit. The Rights Holder for media is the person or group credited.

Director
Tyson Brown, National Geographic Society
Author
National Geographic Society
Production Managers
Gina Borgia, National Geographic Society
Jeanna Sullivan, National Geographic Society
Program Specialists
Sarah Appleton, National Geographic Society, National Geographic Society
Margot Willis, National Geographic Society
other
Last Updated

October 19, 2023

For information on user permissions, please read our Terms of Service. If you have questions about how to cite anything on our website in your project or classroom presentation, please contact your teacher. They will best know the preferred format. When you reach out to them, you will need the page title, URL, and the date you accessed the resource.

Media

If a media asset is downloadable, a download button appears in the corner of the media viewer. If no button appears, you cannot download or save the media.

Text

Text on this page is printable and can be used according to our Terms of Service.

Interactives

Any interactives on this page can only be played while you are visiting our website. You cannot download interactives.

Related Resources